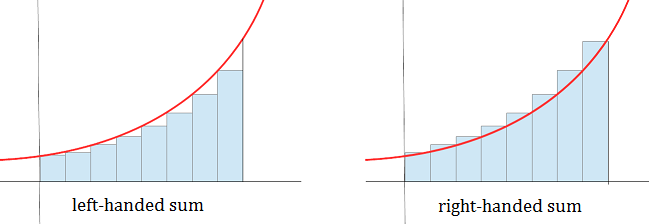
As a high school or undergraduate Mathematics teacher, you can use this set of computer-based tools to help you in teaching topics such as integration, definite integral, area under a curve, and Riemann sum in Introductory Calculus.
This lesson plan allows students to understand Riemann sum, calculate the area under a curve using Riemann sum, and explore how this value converges to a definite integral. The activity helps students to apply the Riemann sums method for analysis and comparison of data on CO2 emission, which is considered to be a significant contributor to climate change.
Thus, the use of this lesson plan allows you to integrate the teaching of a climate science topic with a core topic in Mathematics.

The tools in this lesson plan will enable students to:
Here is a step-by-step guide to using this lesson plan in the classroom/laboratory. We have suggested these steps as a possible plan of action. You may customize the lesson plan according to your preferences and requirements.
Reading and Associated Activity(30 – 60 min)
Use this lesson plan to help your students find answers to:
| 1 | Video | Video tutorial, “Riemann sums”, from Khan Academy This can be accessed here. |
| 1 | Reading and Associated Activity, “Calculating the area under a curve using Riemann sums” | D. Q. Nykamp from Math Insight |
| 2 | Classroom/Laboratory Activity, “U.S. and China CO2 Emissions” | Thomas J. Pfaff, Sustainability Math |
| 3 | Additional Resources | Khan Academy |
Here is a step-by-step guide to using this lesson plan in the classroom/laboratory. We have suggested these steps as a possible plan of action. You may customize the lesson plan according to your preferences and requirements.
Reading and Associated Activity(30 – 60 min)
Micro-lecture (video)(~10 min)
Next, play this micro-lecture (approx. 10 min), “Differentiating polynomials”, to help students further understand polynomial differentiation through examples and exercises.
The micro-lecture “Differentiating Polynomials”, from Khan Academy.
Use the tools and the concepts learned so far to discuss and determine answers to the following questions:Then, help your students apply the learned concepts through a hands-on classroom/laboratory activity,“Mauna Loa Yearly Average CO2”, by Thomas J. Pfaff at Sustainability Math. This activity uses atmospheric CO2 data from the Mauna Loa site for the period 1950 to 2017.
This activity will help students to
Suggested questions/assignments for learning evaluation
Use the tools and the concepts learned so far to discuss and determine answers to the following questions:
Use this lesson plan to help your students find answers to:
| 1 | Visualization | An interactive visualization, “Interactive Graph showing Differentiation of a Polynomial Function” from Interactive Mathematics: This can be accessed here. |
| 1 | Reading, “Derivatives of Polynomials” | World Web Math, Massachusetts Institute of Technology |
| 2 | Micro-lecture (video), “Differentiating polynomials” | Khan Academy |
| 3 | Classroom/laboratory activity, “Mauna Loa Yearly Average CO2” | Thomas J. Pfaff, Sustainability Math |
| 3 | Additional Resources | Interactive Mathematics |
All maps & pedagogical tools are owned by the corresponding creators, authors or organizations as listed on their websites. Please view the individual copyright and ownership details for each tool using the links provided. We do not claim ownership of or responsibility or liability for any of these tools. Images copyrights remain with the respective owners.
TROP ICSU is a project of the International Union of Biological Sciences and Centre for Sustainability, Environment and Climate Change, FLAME University.