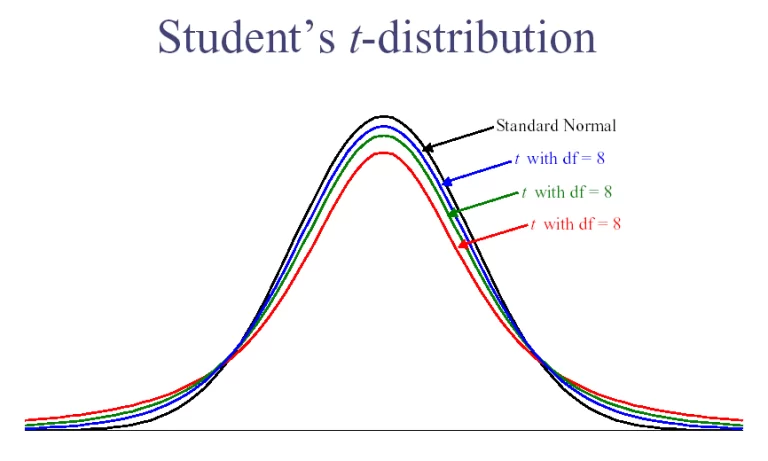
As an undergraduate Statistics teacher, you can use this set of computer-based tools to help you in teaching statistical analysis topics such as Trends, Uncertainty, Confidence interval, and Student’s t-distribution.
As an undergraduate Geography or Earth Sciences teacher, you can use this set of computer-based tools to help you in teaching disasters, hurricanes, the possible impact of climate change on hurricanes, and the analysis of trends in hurricane intensity.
This lesson plan allows your students to perform statistical analysis and interpretation of data (specifically, analyzing trends and determining uncertainty) by using hurricane data records. In the activity, students will explore possible trends in hurricane intensity and number over the past 40 years, and will investigate a possible link between climate change and hurricane strength.
Thus, the use of this lesson plan allows you to integrate the teaching of a climate science topic with a core topic in Statistics, Geography, or Earth Sciences.

The tools in this lesson plan will enable students to:
Here is a step-by-step guide to using this lesson plan in the classroom/laboratory. We have suggested these steps as a possible plan of action. You may customize the lesson plan according to your preferences and requirements.
Micro-lecture (video)(~9 min)
Micro-lecture (video) (~8 min)
Next, explore the topics in more detail through a hands-on classroom/laboratory activity, “Is There a Trend in Hurricane Intensity?”
This activity will help your students determine trends, uncertainties, and confidence intervals by analyzing actual hurricane data records for the Atlantic Ocean over a period of 40 years. They will also discuss the potential link between climate change and hurricane intensity.
Classroom/ Laboratory activity (~60 min)
Then, read the article, “Changes in Hurricanes”, to discuss the changes in hurricane activity and climate-related factors that may affect hurricane development.
The article “Changes in Hurricanes” from GlobalChange.gov,
Use this lesson plan to help your students find answers to:
| 1 | Reading | A reading, “Hurricanes and Climate Change”, from the Center for Climate and Energy Solutions. This can be accessed here. |
| 1 | Micro-lecture (video), “Introducing Confidence Interval” | “Business Applications of Hypothesis Testing and Confidence Interval Estimation” course by Rice University on Coursera |
| 2 | Micro-lecture (video), “t-distribution” | “Inferential Statistics” course by Duke University on Coursera |
| 3 | Classroom/Laboratory activity, “Is There a Trend in Hurricane Intensity?” | Teach the Earth portal at SERC Carleton |
| 4 | Reading, “Changes in Hurricanes” | US Global Change Research Program |
| 5 | Additional Resources | The Center for Climate and Energy Solutions (C2ES) |
Here is a step-by-step guide to using this lesson plan in the classroom/laboratory. We have suggested these steps as a possible plan of action. You may customize the lesson plan according to your preferences and requirements.
Micro-lecture (video)(~9 min)
Micro-lecture (video) (~8 min)
Next, explore the topics in more detail through a hands-on classroom/laboratory activity, “Is There a Trend in Hurricane Intensity?”
This activity will help your students determine trends, uncertainties, and confidence intervals by analyzing actual hurricane data records for the Atlantic Ocean over a period of 40 years. They will also discuss the potential link between climate change and hurricane intensity.
Classroom/ Laboratory activity (~60 min)
Then, read the article, “Changes in Hurricanes”, to discuss the changes in hurricane activity and climate-related factors that may affect hurricane development.
The article “Changes in Hurricanes” from GlobalChange.gov,
Suggested questions/assignments for learning evaluation
Use the tools and the concepts learned so far to discuss and determine answers to the following questions:
Use this lesson plan to help your students find answers to:
| 1 | Reading | A reading, “Hurricanes and Climate Change”, from the Center for Climate and Energy Solutions. This can be accessed here. |
| 1 | Micro-lecture (video), “Introducing Confidence Interval” | “Business Applications of Hypothesis Testing and Confidence Interval Estimation” course by Rice University on Coursera |
| 2 | Micro-lecture (video), “t-distribution” | “Inferential Statistics” course by Duke University on Coursera |
| 3 | Classroom/Laboratory activity, “Is There a Trend in Hurricane Intensity?” | Teach the Earth portal at SERC Carleton |
| 4 | Reading, “Changes in Hurricanes” | GlobalChange.gov |
| 5 | Additional Resources | The Center for Climate and Energy Solutions (C2ES) |
All maps & pedagogical tools are owned by the corresponding creators, authors or organizations as listed on their websites. Please view the individual copyright and ownership details for each tool using the links provided. We do not claim ownership of or responsibility or liability for any of these tools. Images copyrights remain with the respective owners.
TROP ICSU is a project of the International Union of Biological Sciences and Centre for Sustainability, Environment and Climate Change, FLAME University.