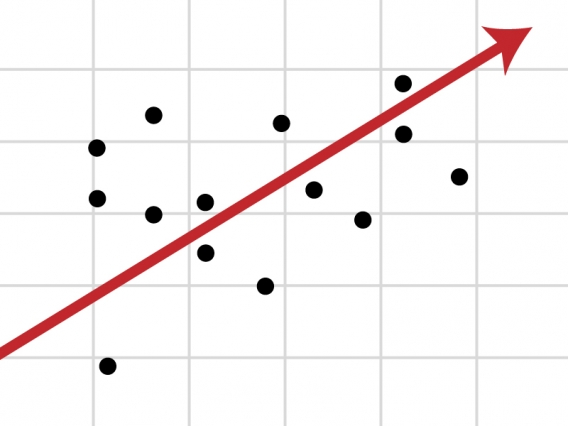
As a high school or undergraduate Mathematics teacher, you can use this set of computer-based tools to help you in teaching introductory statistics and specifically linear regression.
This lesson plan will allow you to teach introductory statistics through a linear regression assignment. The lesson plan includes a hands-on computer-based classroom activity to be conducted on a dataset of Global Temperature Anomalies (1850-2017). This activity includes a set of inquiry-based questions that will enable your students to apply their understanding of scatter plots, regression equations, correlation coefficients, linear regression, and confidence intervals for slopes.
Thus, the use of this lesson plan allows you to integrate the teaching of a climate science topic with a core topic in Mathematics.

The tools in this lesson plan will enable students to:
Here is a step-by-step guide to using this lesson plan in the classroom/laboratory. We have suggested these steps as a possible plan of action. You may customize the lesson plan according to your preferences and requirements.
Teaching Module(25 min)
Use the teaching module, ‘Introduction-Linear Regression and Correlation’ by OpenStaxTM, Rice University (for High School level) or ‘Chapter-3: Linear Regression’ provided by Ramesh Sridharan, Massachusetts Institute of Technology (for Undergraduate level), to introduce these topics of basic statistics.
Navigate to the sub-sections within the module to the basics of scatter plots, correlation coefficients, regression equations, and linear regression.
Use the in-built practice exercises and quizzes to evaluate your students’ understanding of the topics.
Video micro-lecture(~7 min)
Use the video micro-lecture, ‘Confidence interval for the slope of a regression line’ by Khan Academy to explain this inference about a slope.
Navigate to the next subsection and direct your students to solve practice problems on the confidence interval of slope of a regression line to enable better understanding of the topic.
Classroom/ Laboratory activity(20 min)
Visualization (5 min)
Use the interactive visualization of the same dataset, ‘Average temperature anomaly, Global’ by Our World in Data, to encourage discussion amongst your students about the changes in the average global temperatures from the years 1850-2017.
Use this lesson plan to help your students find answers to:
| 1 | Teaching Module, “Introduction- Linear Regression and Correlation” | Provided by OpenStaxTM, Rice University |
| 2 | Teaching Module; ‘Derivatives and the Shape of a Graph’ | Provided by Ramesh Sridharan, MIT from ‘Statistics for Research Projects’ |
| 3 | Classroom Activity; ‘Arctic Sea Ice’ | Presented by Khan Academy |
| 4 | Reading; ‘Polynomials and their Derivatives’ | Provided by Sustainability Math by Thomas J. Pfaff, Professor of Mathematics, Ithaca College, USA |
| 5 | Visualization, “Average temperature anomaly, Global’’ | Developed by Our World in Data |
Here is a step-by-step guide to using this lesson plan in the classroom/laboratory. We have suggested these steps as a possible plan of action. You may customize the lesson plan according to your preferences and requirements.
Teaching Module(25 min)
Use the teaching module, ‘Introduction-Linear Regression and Correlation’ by OpenStaxTM, Rice University (for High School level) or ‘Chapter-3: Linear Regression’ provided by Ramesh Sridharan, Massachusetts Institute of Technology (for Undergraduate level), to introduce these topics of basic statistics.
Navigate to the sub-sections within the module to the basics of scatter plots, correlation coefficients, regression equations, and linear regression.
Use the in-built practice exercises and quizzes to evaluate your students’ understanding of the topics.
Video micro-lecture(~7 min)
Use the video micro-lecture, ‘Confidence interval for the slope of a regression line’ by Khan Academy to explain this inference about a slope.
Navigate to the next subsection and direct your students to solve practice problems on the confidence interval of slope of a regression line to enable better understanding of the topic.
Classroom/ Laboratory activity(20 min)
Visualization (5 min)
Use the interactive visualization of the same dataset, ‘Average temperature anomaly, Global’ by Our World in Data, to encourage discussion amongst your students about the changes in the average global temperatures from the years 1850-2017.
Use the tools and the concepts learned so far to discuss and determine answers to the following questions:
Use this lesson plan to help your students find answers to:
| 1 | Teaching Module, “Introduction- Linear Regression and Correlation” | Provided by OpenStaxTM, Rice University |
| 2 | Teaching Module; ‘Derivatives and the Shape of a Graph’ | Provided by Ramesh Sridharan, MIT from ‘Statistics for Research Projects’ |
| 3 | Classroom Activity; ‘Arctic Sea Ice’ | Presented by Khan Academy |
| 4 | Reading; ‘Polynomials and their Derivatives’ | Provided by Sustainability Math by Thomas J. Pfaff, Professor of Mathematics, Ithaca College, USA |
| 5 | Visualization, “Average temperature anomaly, Global’’ | Developed by Our World in Data |
All maps & pedagogical tools are owned by the corresponding creators, authors or organizations as listed on their websites. Please view the individual copyright and ownership details for each tool using the links provided. We do not claim ownership of or responsibility or liability for any of these tools. Images copyrights remain with the respective owners.
TROP ICSU is a project of the International Union of Biological Sciences and Centre for Sustainability, Environment and Climate Change, FLAME University.