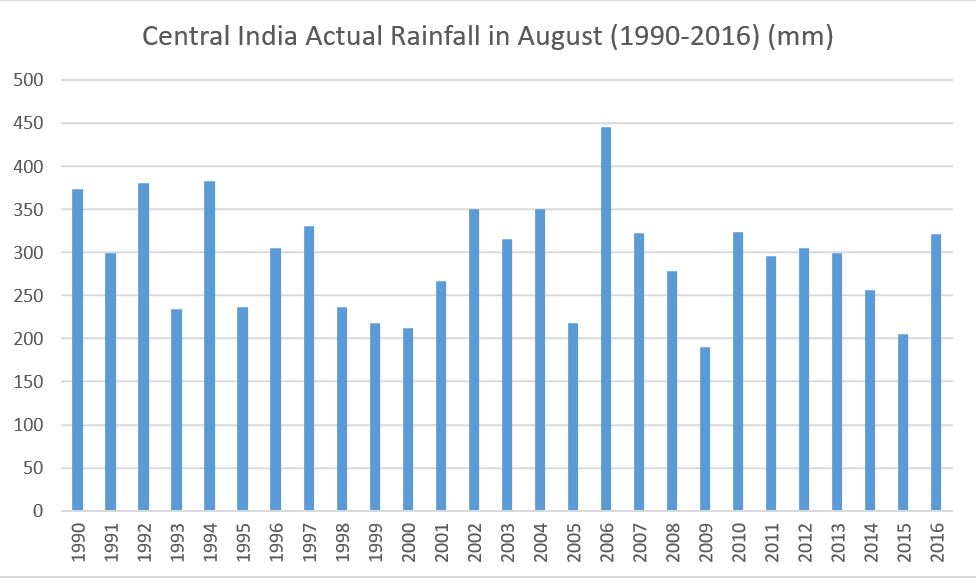
As a Primary and Middle School Mathematics teacher, you can use this set of computer-based tools to teach your students the basics of data handling using climate data.
This lesson plan can be used to introduce your students to data handling, data representation and interpretation using weather and climate data of India. Climate change is believed to cause more frequent extreme weather events such as higher than average temperatures and increased rainfall/precipitation. This lesson plan will enable students to assess such climate variability by analyzing local climate data.
Thus, the use of this lesson plan allows you to integrate the teaching of a climate science topic with a core topic in Mathematics.

The tools in this lesson plan will enable students to:
Teacher-contributed lesson plan by Seema Mittal, Pallavi Surana, Medha Vaidya, Anupama Anikhindi and Varsha Walke, Vidya Valley School, Pune, India.
Want to know more about how to contribute? Contact us.
Here is a step-by-step guide to using this lesson plan in the classroom/laboratory. We have suggested these steps as a possible plan of action. You may customize the lesson plan according to your preferences and requirements.
Teaching Module(~8-12 min)
Use the tool, ‘Representing Data’ by Khan Academy to introduce the concept of a data set to your students. Further, explain how this data can be sorted and represented in tabular form, bar-graphs, line graphs and so on.Explain how the represented data can then be interpreted by asking relevant questions. Use the given practice set of questions to reinforce these concepts.
Teaching Module (10 – 15 min)
Use the teaching module, ‘Creating a bar graph’ by Khan Academy to describe how bar graphs are constructed to represent data. Navigate to the following tabs- ‘Reading Bar graphs’ and ‘Interpreting Bar graphs’ to enable your students to understand how bar graphs are used. Use the practice set of questions within the teaching module to allow students to apply their understanding of these concepts.
Classroom Activity(~10-20 min)
A) Use the website of the Indian Meteorological Department (IMD)
B) Instructions to obtain climate data for Indian cities:
Use this lesson plan to help your students find answers to:
| 1 | Reading; ‘12.1: Stem-and-Leaf Graphs (Stemplots), Line Graphs, and Bar graphs’: | This reading by LibretextsTM that introduces the basic ways of representing categorical data- stem-and-leaf graphs, line graphs and bar graphs.here |
| 1 | Teaching Module; “Representing Data” and “Creating a Bar graph” | Created by Khan Academy |
| 2 | Video; “How to Construct a Climate Graph” | Created and presented by Darron Gedge, New Zealand |
| 3 | Webpage; “City Weather” | By the Indian Meteorological Department (IMD) |
| 4 | Addditional Resources | LibretextsTM |
Here is a step-by-step guide to using this lesson plan in the classroom/laboratory. We have suggested these steps as a possible plan of action. You may customize the lesson plan according to your preferences and requirements.
Teaching Module(~8-12 min)
Use the tool, ‘Representing Data’ by Khan Academy to introduce the concept of a data set to your students.
Further, explain how this data can be sorted and represented in tabular form, bar-graphs, line graphs and so on.
Explain how the represented data can then be interpreted by asking relevant questions.
Use the given practice set of questions to reinforce these concepts.
Teaching Module (10 – 15 min)
Use the teaching module, ‘Creating a bar graph’ by Khan Academy to describe how bar graphs are constructed to represent data.
Navigate to the following tabs- ‘Reading Bar graphs’ and ‘Interpreting Bar graphs’ to enable your students to understand how bar graphs are used.
Use the practice set of questions within the teaching module to allow students to apply their understanding of these concepts.
Classroom Activity(~10-20 min)
A) Use the website of the Indian Meteorological Department (IMD)
B) Instructions to obtain climate data for Indian cities:
C) Conduct the activity with the data obtained as follows:
Use this lesson plan to help your students find answers to:
| 1 | Reading; ‘12.1: Stem-and-Leaf Graphs (Stemplots), Line Graphs, and Bar graphs’: | This reading by LibretextsTM that introduces the basic ways of representing categorical data- stem-and-leaf graphs, line graphs and bar graphs.here |
| 1 | Teaching Module; “Representing Data” and “Creating a Bar graph” | Created by Khan Academy |
| 2 | Video; “How to Construct a Climate Graph” | Created and presented by Darron Gedge, New Zealand |
| 3 | Webpage; “City Weather” | By the Indian Meteorological Department (IMD) |
| 4 | Addditional Resources | LibretextsTM |
All maps & pedagogical tools are owned by the corresponding creators, authors or organizations as listed on their websites. Please view the individual copyright and ownership details for each tool using the links provided. We do not claim ownership of or responsibility or liability for any of these tools. Images copyrights remain with the respective owners.
TROP ICSU is a project of the International Union of Biological Sciences and Centre for Sustainability, Environment and Climate Change, FLAME University.