As a high school or undergraduate Mathematics teacher, you can use this set of computer-based tools to help you in teaching introductory differential calculus and specifically the application of derivatives.
This lesson plan will allow you to teach introductory derivatives, polynomial differentiation, and the application of derivatives. The lesson plan includes a hands-on computer-based classroom activity to be conducted on datasets of Arctic Ice Data (1980-2017). This activity includes a set of inquiry-based questions that will enable your students to apply their understanding of sixth degree polynomial differentiation, maxima/minima values, finding roots and inflection points.
Thus, the use of this lesson plan allows you to integrate the teaching of a climate science topic with a core topic in Mathematics.
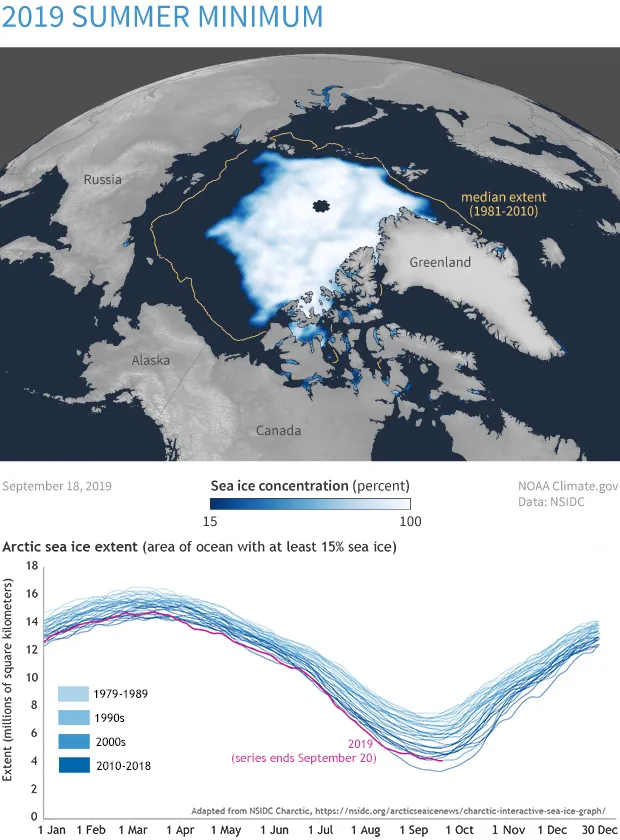
(top) Sea ice concentration (light blue to white) on September 18, 2019, the day of the summer minimum extent. The gold line is the median extent for 1981-2010: half of years had smaller extents, half had larger. (bottom) A graph of daily ice extent each year of the satellite record. Earlier years are in shades of light blue; recent years are in dark blue. The 2019 daily extent line is in dark pink. NOAA Climate.gov image, based on data from the National Snow and Ice Data Center.
The tools in this lesson plan will enable students to:
Here is a step-by-step guide to using this lesson plan in the classroom/laboratory. We have suggested these steps as a possible plan of action. You may customize the lesson plan according to your preferences and requirements.
Teaching Module(30 mins)
Use the teaching module, ‘Differentiation: definition and basic derivative rules’ by Khan Academy, to introduce the concept of derivatives and differentiation. Navigate to the sub-sections within the module to explain derivative rules, the power rule, and how to differentiate polynomials. Use the in-built practice exercises and quizzes to evaluate your students’ understanding of the topics.
Teaching Module(20 mins)
Use the teaching module, ‘Derivatives and the shape of a graph’ by OpenStaxTM, Rice University, to explain to your students how related rates can be compared using derivatives. Use the sub-sections within the tool to explain various mathematical concepts for determining maxima/minima values, roots, and inflection points in the derivative function graph.
Classroom/ Laboratory activity (20 min)
Use the reading, ‘Polynomials and their Derivatives: Polynomials, Critical Points, and Inflection Points’ by Donald Byrd, Indiana University Informatics to reiterate the mathematical concepts to be applied in the ensuing activity.
Use the classroom activity, ‘Arctic Sea Ice’ from Sustainability Math by Thomas J. Pfaff, Professor of Mathematics, Ithaca College, USA, to enable your students to apply their understanding of derivatives, polynomial differentiation and application of derivatives using datasets from the National Snow and Ice Data Center (NSIDC). This classroom activity includes three datasets of the extent of Arctic Sea Ice linked from NSIDC’s observations from 1980 to 2017. This data is provided in an Excel spreadsheet. The classroom activity also includes a Word document that contains directions on how to use different mathematical methods on the data provided. It further includes questions that you may wish to use in your classroom to explain mathematical functions and methods and to initiate a discussion on the decrease in extent of Arctic Sea Ice due to the Ice Albedo Feedback and anthropogenically forced Global Warming (links to explanatory notes given within the tool). Direct your students to download the Excel file (with dataset) and the Word document (with directions to use the dataset and a set of questions to analyze the dataset). Proceed with the classroom activity and encourage your students to answer the questions by applying their understanding of function graph, maxima/minima, roots, and inflection points.
Visualization (5 min)
Use the visualization, ‘Charctic Interactive Sea Ice Graph”’ from NSIDC to encourage discussion amongst your students about the changes in the extent of Arctic Sea Ice from the years 1979-2020. Discuss how these changes could be the result of changes in the Earth’s climate in recent times.
Use the tools and the concepts learned so far to discuss and determine answers to the following questions:
Use this lesson plan to help your students find answers to:
| 1 | Teaching Module; ‘Differentiation: definition and basic derivative rules’ | Developed by Khan Academy |
| 2 | Teaching Module; ‘Derivatives and the Shape of a Graph’ | Provided by OpenStaxTM, Rice University |
| 3 | Classroom Activity; ‘Arctic Sea Ice’ | Provided by Sustainability Math by Thomas J. Pfaff, Professor of Mathematics, Ithaca College, USA |
| 4 | Reading; ‘Polynomials and their Derivatives’ | By Donald Byrd, Indiana University Informatics |
| 5 | Visualization; ‘Charctic Interactive Sea Ice Graph’ | From National Snow and Ice Data Center (NSIDC) |
All maps & pedagogical tools are owned by the corresponding creators, authors or organizations as listed on their websites. Please view the individual copyright and ownership details for each tool using the links provided. We do not claim ownership of or responsibility or liability for any of these tools. Images copyrights remain with the respective owners.
TROP ICSU is a project of the International Union of Biological Sciences and Centre for Sustainability, Environment and Climate Change, FLAME University.